A quote that required contacting sales
Then discovery, then a number you did not expect.
For teams that evaluated a legacy ICM and walked away over price, the implementation project or the black box. Clear public pricing, and calculation auditable to the transaction.

Then discovery, then a number you did not expect.
With a systems integrator before the first calculation.
With no way to see inside when the number is questioned.
Legacy ICM
Contact sales, after an NDA
Vialuce
Clear and public, by entity bands
Legacy ICM
Implementation project with an integrator
Vialuce
Configurable by you, on your own data
Legacy ICM
USD 55 to 75 / entity / month
Vialuce
From USD 1.20 / entity / month
Legacy ICM
Annual minimum
Vialuce
Monthly, cancel anytime
Legacy ICM
Black box
Vialuce
100% deterministic, auditable to the transaction
Legacy ICM
Depends on the vendor
Vialuce
Same input, same output, reproducible
Legacy ICM
English only
Vialuce
Spanish · English · Portuguese
| Legacy ICM | Vialuce | |
|---|---|---|
| Pricing | Contact sales, after an NDA | Clear and public, by entity bands |
| Getting started | Implementation project with an integrator | Configurable by you, on your own data |
| Cost per entity | USD 55 to 75 / entity / month | From USD 1.20 / entity / month |
| Contract | Annual minimum | Monthly, cancel anytime |
| Calculation logic | Black box | 100% deterministic, auditable to the transaction |
| Precision | Depends on the vendor | Same input, same output, reproducible |
| Languages | English only | Spanish · English · Portuguese |
You can sign a six-figure black box, or you can choose logic you can open down to the transaction the day your CFO questions a number.
Every result reconciled against your current numbers, with each component's logic in plain sight: how it pays, what it reads, what conditions apply.

Open any number down to the transactions that generated it.
Bands by entities, prorated changes, monthly or annual. No contacting sales, the price is in the comparison table on this page.
Tenant isolation, encryption in transit and at rest, immutable audit trail and configurable residency.
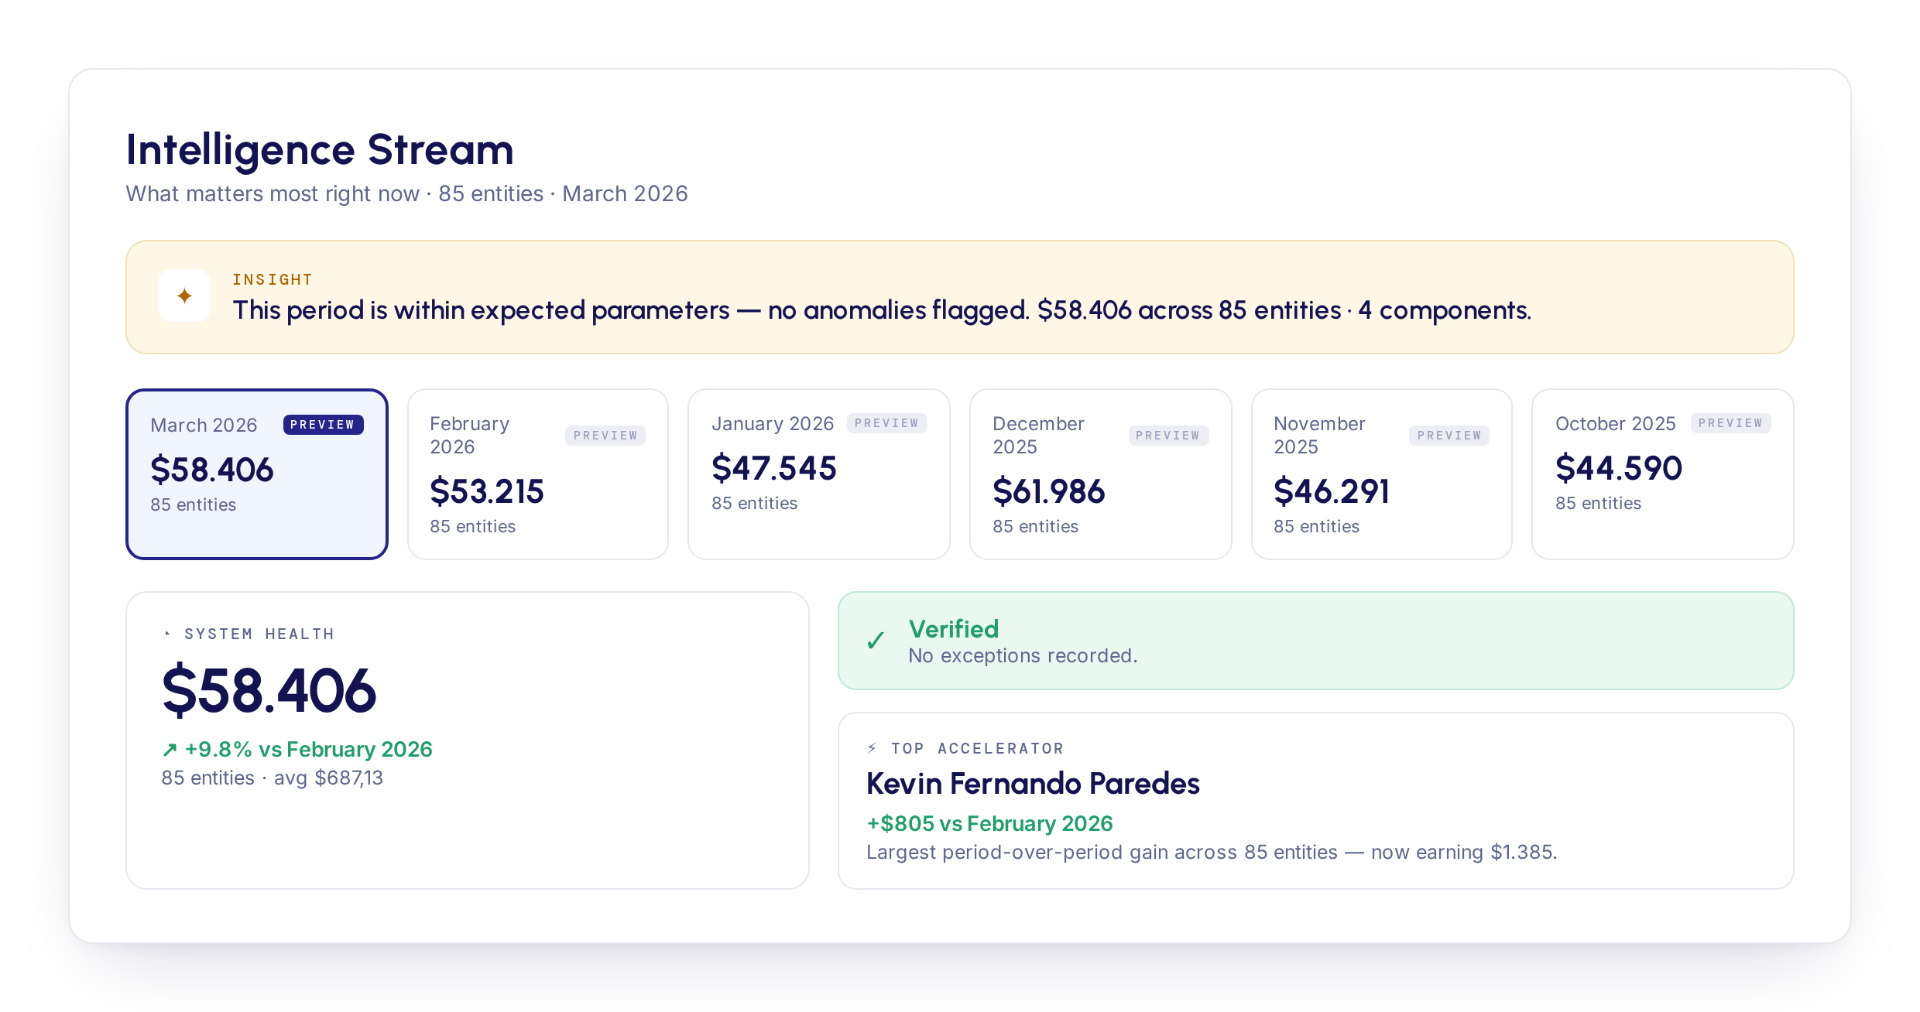
The same business rules build any plan, with validation and control in plain sight.

It is not just cheaper: it is a number your whole team can defend. Comp, finance and audit on the same deterministic truth, instead of a black box nobody can explain.
No forced migration, no mandatory integrator.
Pricing is on the page, by bands. No mandatory integrator.
The same precision you evaluated, auditable and at a fraction of the cost, with the logic in plain sight instead of a black box.